We have a specific application that outputs debugging messages that are usually visible in the Windows Debug console view via the Sysinternals DebugView or DebugView++ desktop applications.
When we start the same application from AlwaysUp, I don’t see the debug messages in the DebugView console. Do you know where they go?
— Giovanni
Hi Giovanni, thanks for getting in touch.
We’ve seen this problem before. To explain in a sentence, you’re not seeing your applications debug messages because AlwaysUp is running your application in Session 0 while DebugView is monitoring your logon session.
But that’s a mouthful! Let’s try to explain what it means. 🙂
Windows Sessions, in a nutshell
To understand what’s going on, it’s important to be aware of Windows sessions and how they work. In case you could use a refresher on this very technical topic, here are a few facts about sessions:
When you log in to your computer, Windows creates a new session for you. That session stays open until you log out — or Windows restarts. You can think of a session as the “container” for your entire login experience.
A session holds your desktop and all the programs you launch. Indeed, every application you start runs in your session.
By design, Windows allows programs running in the same session to communicate freely. However, because of security restrictions, applications running in different sessions cannot easily interact.
For example, an application running in your session cannot use the popular EnumWindows API function to list the top-level windows in someone else’s session. Windows simply disallows that overreach.
Sessions are numbered. The first person to log in to the computer is given Session 1 (“the session with ID 1”). The next person to log in is assigned Session 2, and so on.
When your computer boots, Windows automatically creates a special session, called Session 0. All Windows Services — which may start at boot before anyone logs on — run in Session 0.
Session 0 is sometimes called the “console” or “background” session because of the special role it plays.
And with that framework in place, let’s return to your specific situation.
DebugView and your application are running in different Windows sessions
When you logged into your PC — either using the keyboard and mouse or remotely via RDP — Windows created a new session for you. Let’s say it’s Session 1 (but it could just as well be Session 2 or 3 if you weren’t the first person to log in after boot).
So when you start DebugView on your desktop, Windows launches it in Session 1. DebugView comes up visibly on your desktop, like any other application you start.
Similarly, when you start your application normally (without AlwaysUp), it will likely pop up on-screen as well. And DebugView will log its debugging messages, as expected.
But the situation is different when AlwaysUp runs your application. Instead of starting it visibly on your desktop, in Session 1, AlwaysUp starts your application in Session 0 — the session created at boot. Recall that’s where all Windows Services operate.
In that situation, DebugView will not capture messages from your application. That’s because DebugView is only monitoring applications running in Session 1 — the same session where it’s running.
The solution: Configure DebugView to capture messages from Session 0
Fortunately there’s a simple fix:
Start DebugView.
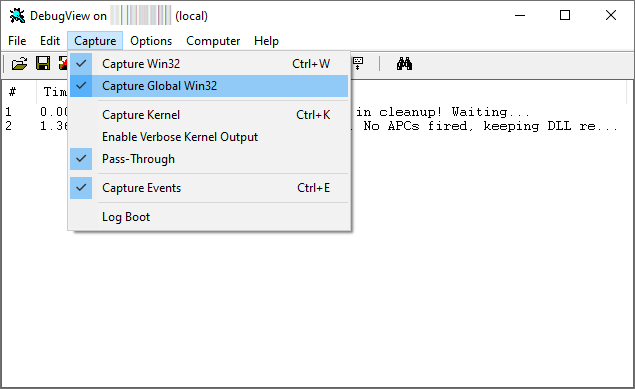
Select the Capture menu and ensure that Capture Global Win32 is checked:
With that option active, DebugView will capture messages from all Windows sessions — not only the session where it’s running.
The somewhat dated DebugView help file explains what’s going on this way:
You can capture debug messages from all sessions with DebugView++ too
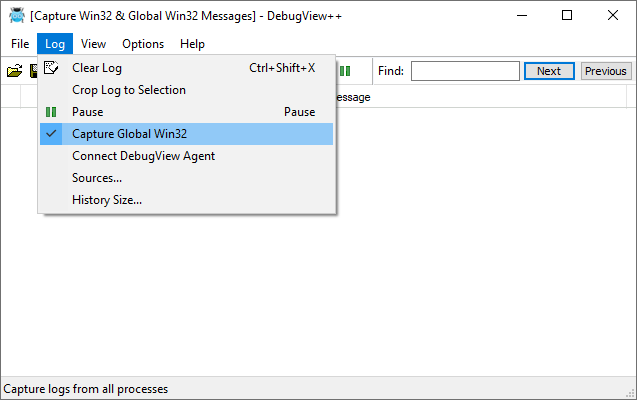
DebugView++ provides a similar Capture Global Win32 option, which is on by default. It’s available under the Log menu:
So you’re free to use either tool when running your application as a Windows Service with AlwaysUp.
Happy debugging!


